
How to create a Stacked Area Chart using Recharts?
RechartJS is a library that is used for creating charts for ReactJS. So, in this article, we will see how to create a Stacked Area Chart using Recharts.
How to create a Stacked Area Chart using Recharts?
RechartJS library is used for building Line charts, Bar charts, Pie charts, etc. It is done with the help of React and D3 (Data-Driven Documents). A Stacked Area Chart is the extension of a basic area chart. It displays various continuous data in the same area chart for a better comparison of data. An area chart combines the line chart and bar chart to demonstrate numeric value deviation over a certain progressive variable.
To create a Stacked Area Chart we use AreaChart component of recharts npm package. We firstly create a cartesian grid and X-axis and Y-Axis. Then add multiple Area charts using the Area components and get them stacked on top of each other. We use the same stackId for all charts.
Creating React Application And Installing Module:
1) Create a React application using the following command.
npx create-react-app foldername
2) After creating your project folder i.e. folder name, move to it using the following command.
cd foldername
3) After creating the ReactJS application, Install the required modules using the following command.
npm install --save recharts
Example 1:
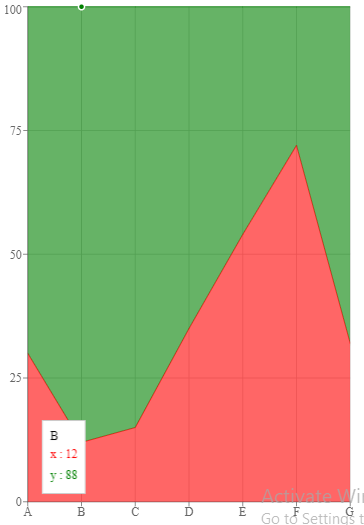
Here, we will create a basic stacked Area chart using AreaChart and Area component of recharts npm package. To stack the two area chart component on top of each other we will add the same stackId to both Area components. Now write down the following code in the App.js file. Here, App is our default component where we have written our code.
import React from 'react';
import {AreaChart, Area, XAxis, YAxis,
  CartesianGrid, Tooltip} from 'recharts';

const App = () => {

  // Sample data
  const data = [
    {name:"A", x:30, y:70},
    {name:"B", x:12, y:88},
    {name:"C", x:15, y:85},
    {name:"D", x:35, y:65},
    {name:"E", x:54, y:46},
    {name:"F", x:72, y:28},
    {name:"G", x:32, y:68}
  ];


  return (
  <AreaChart width={500} height={700} data={data}>
    <CartesianGrid/>
    <XAxis dataKey="name" />
    <YAxis />
    <Tooltip />
    <Area dataKey="x" stackId="1"
      stroke="green" fill="green" />
    <Area dataKey="y" stackId="1"
      stroke="blue" fill="blue" />
    </AreaChart>
  );
}

export default App;
Run the application using the following command from the root directory of the project:
npm start
Now open your browser and go to http://localhost:3000/, you will see the following output:

Example 2:
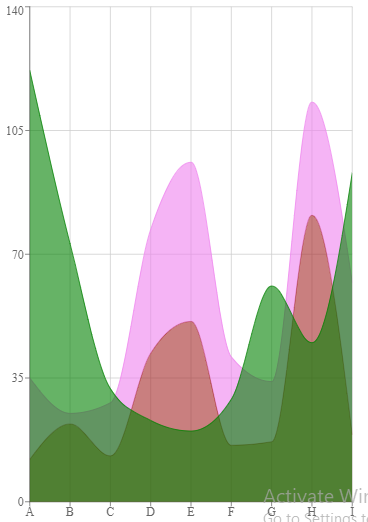
Here, to convert this from an area chart to a curved graph we will set the type property to monotone. And if we want area charts to stack on top of each other and third to overlap them instead of stacking we will give different stack id to one which needs to overlap and the same to those which have to be stacked. Now change the following code in the App.js file.
import React from 'react';
import {AreaChart, Area, XAxis, YAxis,
  CartesianGrid } from 'recharts';

const App = () => {

  // Sample data
  const data = [
    {name:'A', x:12, y:23, z:122},
    {name:'B', x:22, y:3, z:73},
    {name:'C', x:13, y:15, z:32},
    {name:'D', x:42, y:35, z:23},
    {name:'E', x:51, y:45, z:20},
    {name:'F', x:16, y:25, z:29},
    {name:'G', x:17, y:17, z:61},
    {name:'H', x:81, y:32, z:45},
    {name:'I', x:19, y:43, z:93},
  ];

  return (
  <AreaChart width={500} height={700} data={data}>
    <CartesianGrid/>
    <XAxis dataKey="name" />
    <YAxis />
    <Area type="monotone" dataKey="x"
      stackId="1" stroke="black" fill="black" />
    <Area type="monotone" dataKey="y"
      stackId="1" stroke="blue" fill="blue" />
    <Area type="monotone" dataKey="z"
       stackId="2" stroke="green" fill="green" />
  </AreaChart>
  );
}

export default App;
Run the application using the following command from the root directory of the project:
npm start
Now open your browser and go to http://localhost:3000/, you will see the following output:
Conclusion:
So, in this article, we have been through how to create a Stacked Area Chart using Recharts. Also, feel free to comment with your suggestions and feedback on the post. Moreover, at BOSC Tech Labs, we have a team of highly experienced React JS developers. They can assist you in developing your customized web app. So contact us to hire experienced ReactJS developers.