Analytics Dashboard Services for Consistent Business Reporting
Design analytics dashboards that connect trusted metrics, operational context, and role-based views in one maintainable system. We establish metric logic, validate source paths, and structure access so teams can review performance without manual reconciliation.
Trusted by Operations-Led Teams


Analytics Dashboard Services for Performance Tracking
We build analytics dashboards with trusted data models, structured KPIs, access controls, and governance for ongoing decision-making.
Identify the decisions each dashboard must support, the metrics that matter, and the manual work currently slowing reviews, planning, or operational tracking.
Decision & KPI
Discovery
Define KPI formulas, dimensions, business rules, & ownership so performance views remain consistent across departments, tools, & recurring reviews.
Metric Logic &
Semantic Modeling
Connect CRM, ERP, finance, product, support, spreadsheets, APIs, warehouses, and operational databases with validation rules that prevent mismatches.
Source Integration & Data Preparation
Structure controlled views for executives, managers, analysts, and operating teams so each group sees the right level of detail and context.
Dashboard Experience
& Information Design
Develop dashboards in Power BI, Tableau, Looker, Metabase, embedded analytics, or custom interfaces based on your data model and access needs.
BI Dashboard Development
Configure refresh schedules, alerts, exports, subscriptions, and review views so teams depend less on manual updates and recurring analyst requests.
Refresh, Alerts &
Review Automation
Add validation checks, role-based access, row-level security, documentation, and change controls to keep dashboards controlled as teams and metrics evolve.
Data Quality &
Access Governance
Improve query structure, dashboard performance, model efficiency, and refresh reliability while providing internal teams with clear documentation and maintenance ownership.
Performance Tuning
& Ownership Transfer
Why Business Dashboards Stop Being Trustworthy
Analytics loses its value when metric logic, data validation, access rules, and ownership are not clearly defined. Without these foundations, dashboards generate more questions than answers, and reporting becomes a source of friction rather than clarity.

Leadership meetings rely on numbers that teams still need to verify manually

The same KPI changes depending on the source system, team, or spreadsheet

Dashboards show final numbers but do not explain drivers, exceptions, or context

Finance, sales, operations, and product reports are built from disconnected data paths

Teams depend on analysts for recurring exports, refresh fixes, and reporting requests

Access rules are unclear, making sensitive data either overexposed or too restricted

Dashboard performance drops as filters, datasets, users, and reporting views expand

Reporting logic changes over time without documentation, validation, or clear ownership
Trusted by Growing &
Established Companies
Organizations need clarity on where automation creates value, how it affects operations, and what it will require to sustain. Our role begins at that point of decision.
6+
Years in engineering
and system delivery
90+
AI-skilled product
engineers
50+
Systems
modernized
30+
clients with 3+
years retention
Kudos from Clients
“BOSC Tech Labs Private Limited has delivered a solution with excellent PageSpeed insights and achieved easy post-launch management for the client. The service provider is highly responsive to the client’s changing requests. Their project management, timeliness, and client-orientedness are exemplary.”

De Ivett
CEO, 5D Spectrum
“BOSC Tech Labs has very good developers. they have a very broad knowledge. they understood exactly my concept and helped to make it mature. BOSC Tech Labs supported me all the way to production. You can see the final product in the App Store HipMeal.com. I will keep working with BOSC Tech Labs in the future.”

Said Zejjari
CEO, HipMeal & HipSmile
“I am satisfied with the way of work. BOSC Tech Labs has remarkably enhanced our proficiency in Flutter software, thanks to their dedicated and transparent approach in education. Their skilled and knowledgeable team has been a standout in our collaborative workflow.”

Brock Bradshaw
Tech Lead, UME
“This is the 1st time I worked with BOSC Tech Labs, which wasn’t a personal recommendation. They delivered above the expected level. Their one-person team expertly developed an MVP with innovation, significantly boosting customer engagement. Their swift approach & consistent delivery beyond expectations made the project a resounding success.”

Samir Lakhani
CEO, Letsplay
“The amazing team to work with, and they provided us with great results. We’re thrilled with the on-time launch of our app’s beta version by the team, which significantly addressed our initial backlog and exceeded expectations. Their proactive project management and impressive quality of deliverables left us and our stakeholders thoroughly impressed.”

Nicholas Lavis
Co-Founder, Lumin
“Thanks to the efforts of BOSC Tech Labs Private Limited, the time required to launch new features has been reduced by 20%. The team has proved collaborative, responsive, and punctual, demonstrating a structured approach that contributed to a seamless collaboration.”

Nils Kröger
Managing Director, Workbase
“BOSC Tech has excellent mobile & web app development skills using Flutter technology. BOSCs expertise in Google Cloud & Flutter is remarkable, showcasing their depth of knowledge and versatility. Their team’s communicative & adaptable approach, with outstanding mobile app development skills, made our collaboration seamless.”

Bojana Miloradovic Parman
Product Development Lead, Airphoto
“The client was satisfied with BOSC Tech Labs Private Limited's efforts. The team provided regular status updates and demo presentations, showcasing excellent project management skills. Moreover, the team was experienced, pleasant to work with, and willing to help with challenging topics.”

Zoran Galic
Founder, QSoft Labs GmbH
“BOSC Tech Labs has successfully delivered complex applications to the client on time. The team has shown professionalism, great insights, and the ability to think through problems and provide scalable solutions. The client has also praised the team's responsiveness and flexible development schedule.”

Andrew Daniels
Founder & Co-Owner, Kaleo Design
“BOSC Tech Labs implemented features for the client's Flutter SDK and created good documentation. The team was helpful and demonstrated an impressive Flutter experience, guiding the client to create a Flutter version of their native SDK. BOSC Tech Labs delivered work on time and communicated quickly.”

Özgür Hangişi
Founder, WebInStats Yazılım Hizmetleri San. ve Tic. LTD. ŞTİ.
Business Analytics Systems for Core Functions
We structure analytics systems around the reviews, scorecards, and operating rhythms that guide core business functions. Each view connects metrics, context, and exception signals so teams can see what changed, why it matters, and where action is needed.
Leadership Review Dashboards
Consolidate business health metrics, priority KPIs, and department performance into a single governed view structured around executive review cycles.
Revenue and Pipeline Dashboards
Surface pipeline quality, conversion movement, account progress, forecast risk, and revenue trends from CRM and sales data in a validated, refresh-automated view.
Finance and Margin Dashboards
Connect revenue, cost, margin, collections, and budget variance data into governed finance views segmented by team, service, or business unit.
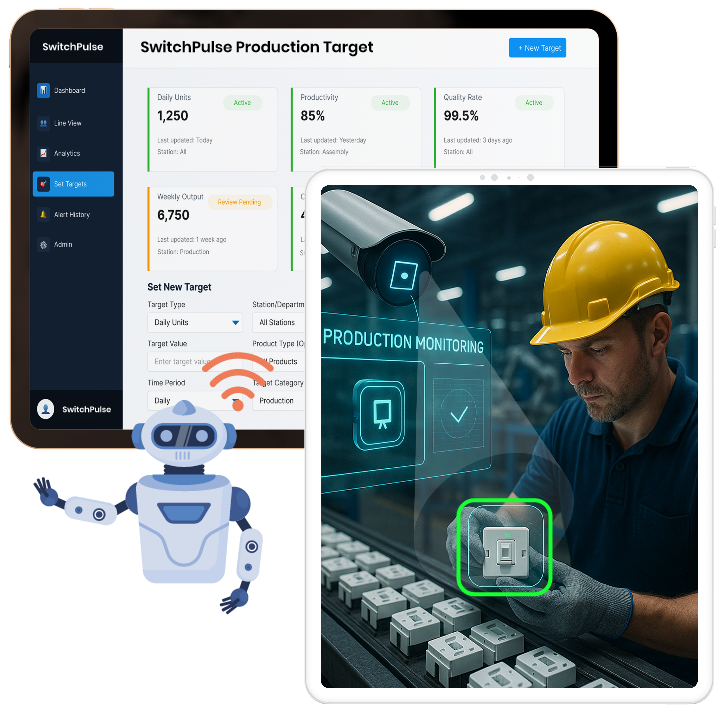
Operations Performance Dashboards
Track throughput, workload distribution, SLA movement, exceptions, and process bottlenecks across operational workflows in a structured, role-appropriate view.
Customer Support Dashboards
Aggregate ticket movement, response patterns, escalation load, resolution trends, and team capacity across support channels into a structured service operations view.
Product Usage Dashboards
Connect product event data, feature usage signals, retention patterns, and customer behavior into views that support product and engineering review cycles.
Department Scorecards
Build focused scorecards for sales, finance, operations, support, and product functions — each structured around the metrics and review rhythm relevant to that team.
Embedded Customer Analytics
Embed governed dashboard views inside SaaS products, portals, or internal platforms to deliver controlled, user-scoped visibility into activity, performance, or account data.
Identify Where Your Reporting is Breaking Down
Review KPI formulas, source paths, and refresh schedules to see whether the issue sits in dashboard design, the semantic model, or upstream data.

From Business Questions to Validated Analytics Dashboards
BOSC starts with the decisions each review must support, then traces KPIs to source data, defines access, builds the analytics view, validates numbers, and leaves ownership clear.
Identify the Review Questions
Clarify what leadership, finance, sales, operations, or product teams need to understand during recurring reviews.
Lock the KPI Logic
Define formulas, filters, dimensions, time periods, exclusions, and owners for every priority metric.
Trace the Data Paths
Map each KPI to CRM, ERP, finance, product, support, warehouse, spreadsheet, or API sources.
Define Access Rules
Set role-based views, sensitive-data controls, row-level restrictions, and permissions before dashboards are shared.
Shape the Analytics View
Design the dashboard structure, filters, hierarchy, drill-downs, and visual emphasis to align with the user’s actual review flow.
Reconcile the Numbers
Compare outputs against trusted sources, test edge cases, verify refresh behavior, and resolve mismatched values before launch.
Set Ownership and Change Control
Document metric logic, refresh paths, access rules, and change processes so dashboards can be maintained without informal knowledge.
Success Stories Shaped by a Structured Approach


What Sets BOSC Apart in Analytics Dashboard Engineering
BOSC combines data engineering, product thinking, BI development, and long-term ownership to build dashboards that remain useful as systems, teams, and reporting needs change.

Metrics Before Visuals
Define business logic, ownership, and reporting purpose before choosing charts, layouts, or tool-specific features.
Data Foundation Awareness
Identify whether dashboard issues arise from data quality, pipelines, models, permissions, or governance — rather than defaulting to a UI redesign.
Tool-Agnostic BI Engineering
Work with the BI stack that fits your environment — Power BI, Tableau, Looker, Metabase, embedded analytics, or custom dashboards — without pushing a preferred tool.
Governance Built Into Reporting
Account for access control, row-level security, metric documentation, refresh ownership, and change management from the start — not after the dashboard is live.
Industries We Work With
Our work spans industries where teams handle complex workflows, heavy information flow, and high stakes for consistency and speed. We adapt the system design to your operating model and not generic patterns.

Healthcare
Strengthen operational systems and intelligence without disrupting clinical or patient workflows.

Sports
Support performance, analysis, and operational decision-making through data and vision-driven systems.

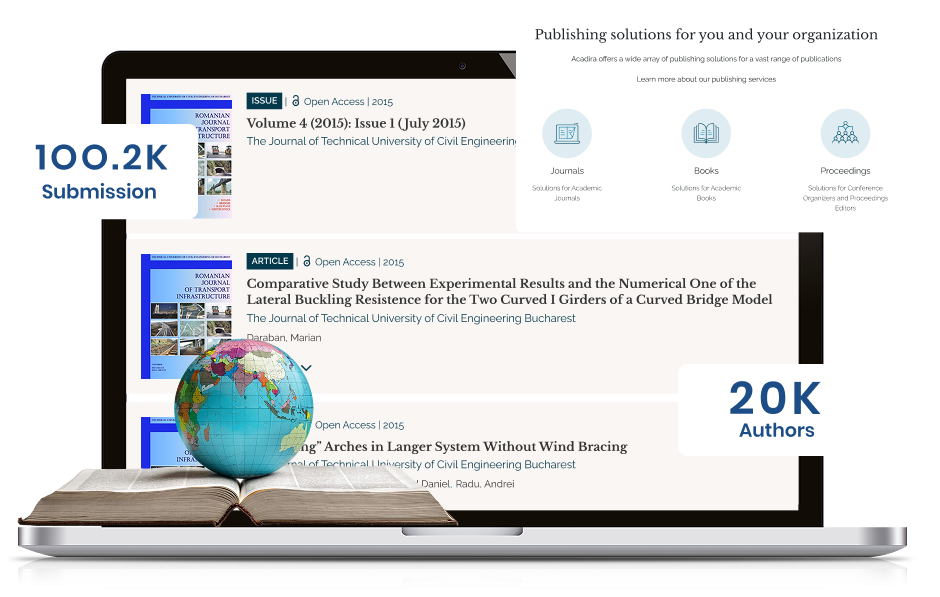
Media & Publishing
Enable scalable content operations, insight generation, and audience intelligence across platforms.

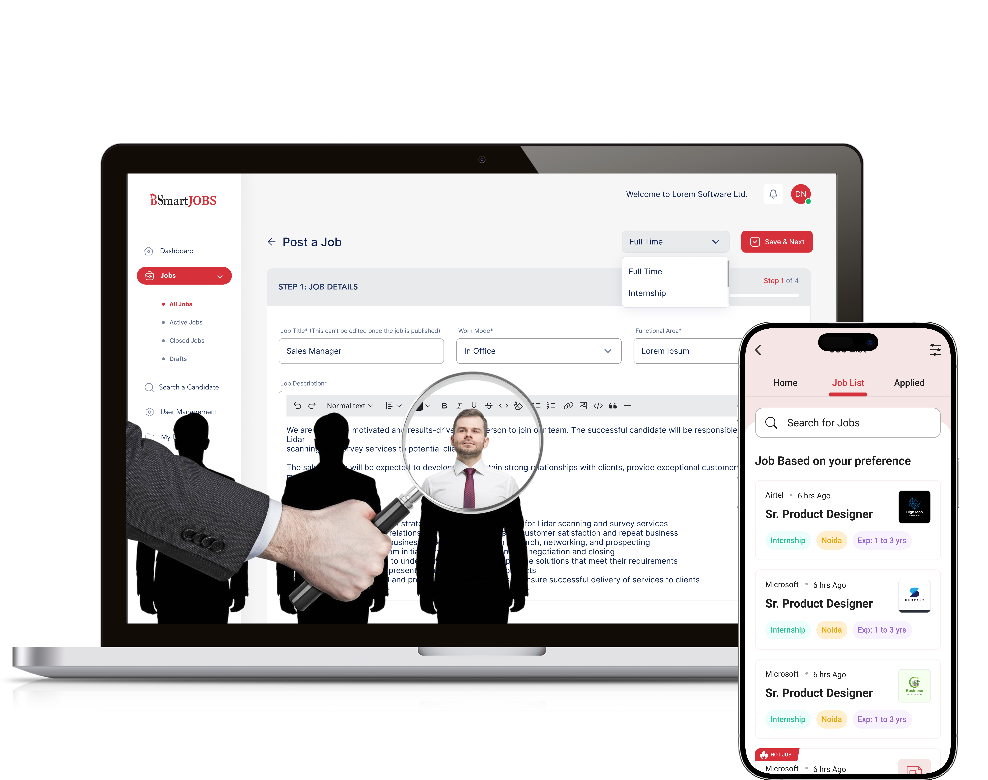
SaaS & Technology
Modernise and extend platforms to support scale, stability, and continuous product evolution.

Manufacturing
Improve inspection quality, defect detection, and shift-level decisions through AI and vision systems built for the factory floor.
Know Whether the Fix Is UX, Data Modeling, or Source Cleanup
Dashboard issues rarely come from visuals alone. BOSC identifies the constraint in metric logic, source quality, permissions, and performance before recommending a rebuild.


Want to Know More
How do you decide whether to rebuild our dashboards or fix the underlying data model?
Usually, check the model first. If KPI logic, relationships, refresh paths, or source quality are weak, a redesigned dashboard will still show unreliable numbers.
How do you resolve situations where different teams are seeing different values for the same KPI?
Common causes include different formulas, filters, source systems, time windows, manual exports, or undocumented metric changes. We align definitions before rebuilding views.
Can BOSC work with our existing Power BI, Tableau, Looker, or Metabase setup?
Yes. BOSC can improve dashboards within your current BI stack or recommend changes only when governance, performance, access, or maintenance needs warrant them.
What data needs to be ready before dashboard development starts?
You need clear source systems, KPI definitions, user roles, refresh expectations, and known data gaps. A full warehouse is useful, but not always required first.
How do you control sensitive finance, sales, or customer data?
We define role-based access, row-level restrictions, and permission rules as part of the build, so sensitive data is accessible only to the right users from day one.
How do you diagnose and fix dashboards that are slow or difficult for teams to use?
Likely causes include heavy visuals, poor data models, inefficient queries, large datasets, unclear filters, weak navigation, or BI environments that were not optimized.
Perspectives on Engineering, Data, and AI
- Top 5 AI Agent Use Cases for Businesses in 2026
 Your AI agent can chat all day, but can it actually finish a task? These AI agent case studies show 5 real examples of agents getting real work done, fast.
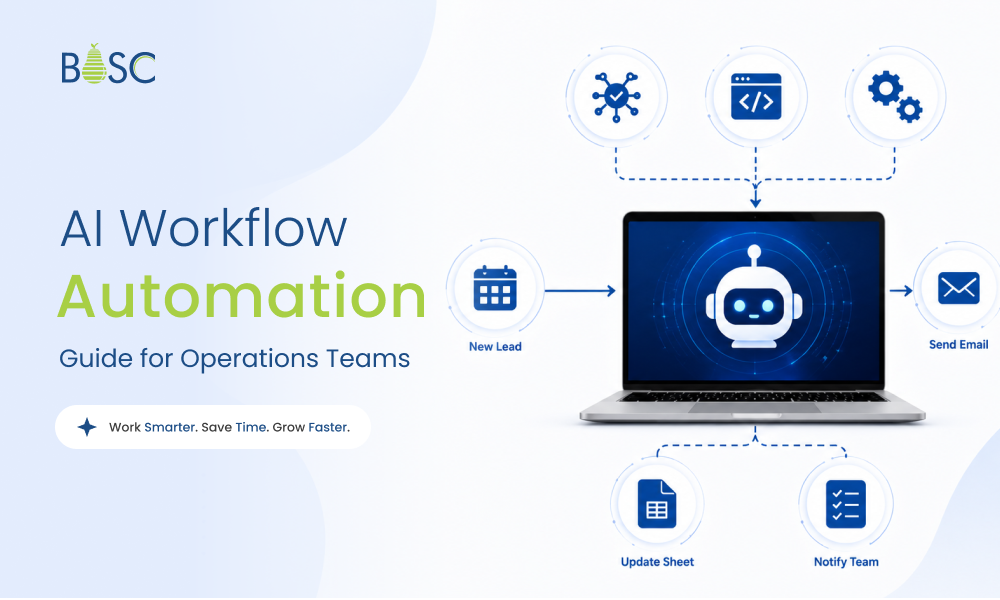
 - AI Workflow Automation: How Operations-Led Teams Connect Systems, Reduce Coordination, and Scale DeliveryBusinesses have already introduced AI into parts of their operations. But in many cases, the work itself still moves the same way it always did,… Read more: AI Workflow Automation: How Operations-Led Teams Connect Systems, Reduce Coordination, and Scale Delivery
- How Foundersmate Works: A Founder’s Breakdown of Every Tool, Every Output, Every FeatureMost startup ideas begin with conviction. A founder sees a problem, imagines a product, and believes there is a market for it. But belief is… Read more: How Foundersmate Works: A Founder’s Breakdown of Every Tool, Every Output, Every Feature